
CellScape™ XR Platform
Discover, validate, and translate phenotypes with quantitative spatial proteomics
The CellScape XR platform helps researchers discover, validate, and translate spatial phenotypes in intact tissue. Quantitative subcellular proteomics delivers the confidence needed to characterize cell states, biomarkers, and spatial interactions at single-cell resolution.
Quantitative Spatial Phenotyping
Learn how quantitative spatial phenotyping reveals cell states, tissue organization, and spatial interactions with greater confidence.
Precise Spatial Proteomics 101: Introduction to the CellScape XR Platform
Discover how the CellScape XR platform enables quantitative spatial phenotyping for translational and biomarker research.
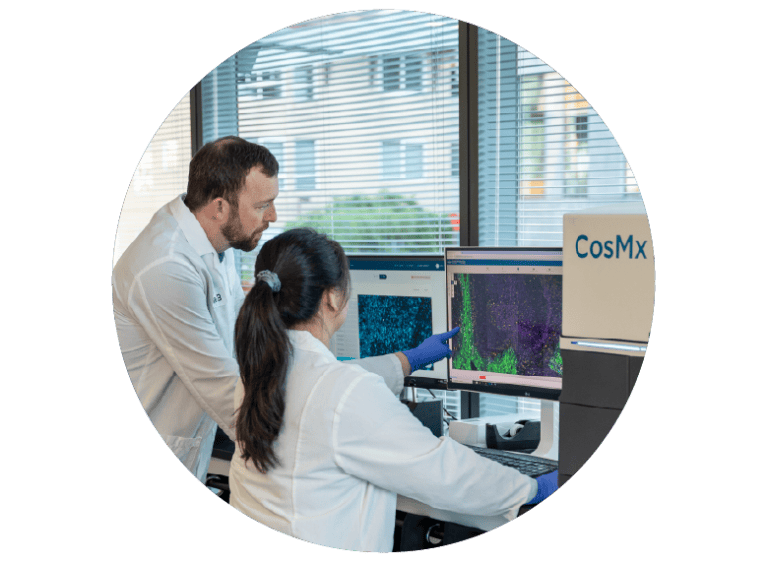
Explore high-resolution spatial proteomics data from real CellScape experiments
Interact with real CellScape datasets and explore quantitative spatial proteomics at single-cell and subcellular resolution.
Spatial proteomics for quantitative phenotyping
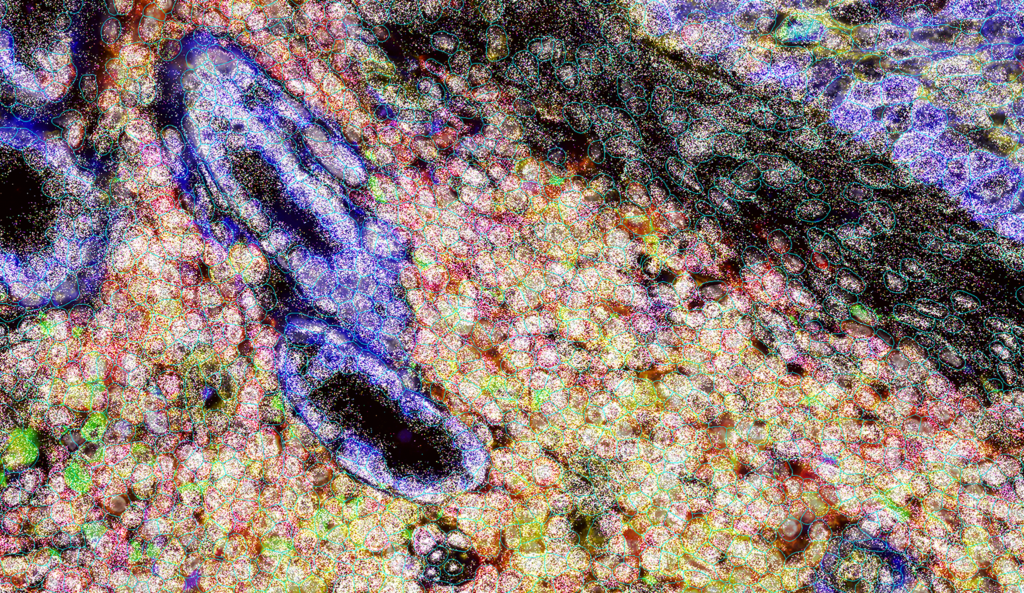
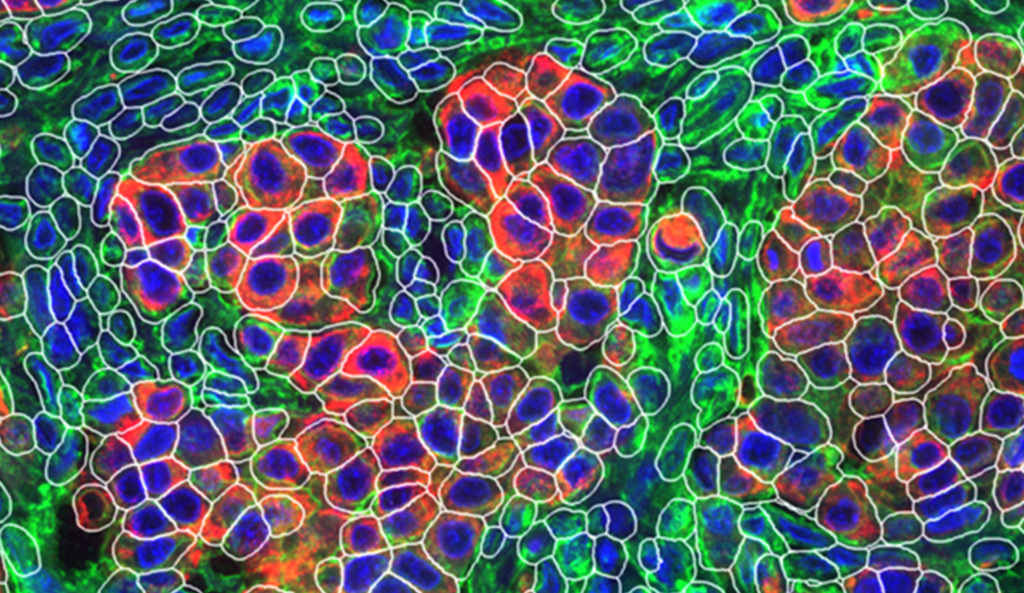
Best-in-class resolution
Resolve single cells and subcellular structures
Segmentation you can trust. At 182 nm/px, the CellScape XR platform assigns every biomarker to the correct cell.
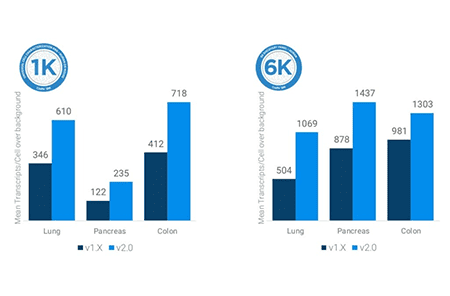
High dynamic range imaging
Capture the full spectrum of biomarker expression
Biology isn’t binary. The CellScape XR platform’s 8-log dynamic range captures low-, mid-, and high-expressing cells in one image instead of forcing positive/negative calls.
Whole-slide imaging
Image entire 16×40 mm tissue sections at a single-cell resolution
No tiling tradeoffs, no field-of-view limits. The CellScape XR platform images whole 16×40 mm sections at single-cell resolution, revealing relationships across millions of cells.
Flexible Assay Design
Effortless customization with any marker
Use any IHC-validated antibody, VistaPlex kits, commercial vendor, or your own, so you design panels around your biology, not the platform.
Gentle, complete signal removal
Bright fluorophores, clean signal, every cycle
Robust data starts with clean cycles. EpicIF technology removes signal completely and leaves epitopes intact, so you can use the brightest organic fluorophores across 50+ cycles.
Scale with Confidence
Increase throughput without sacrificing quantitative performance
Scaling up shouldn’t mean slowing down or settling for weaker data. The CellScape XR platform runs multiple samples in parallel and captures up to 5 markers per cycle across 7 channels, compressing high-plex experiments from weeks into days, at the same quantitative performance every cycle. Grow study size and sample volume without trading away the fidelity your conclusions depend on.
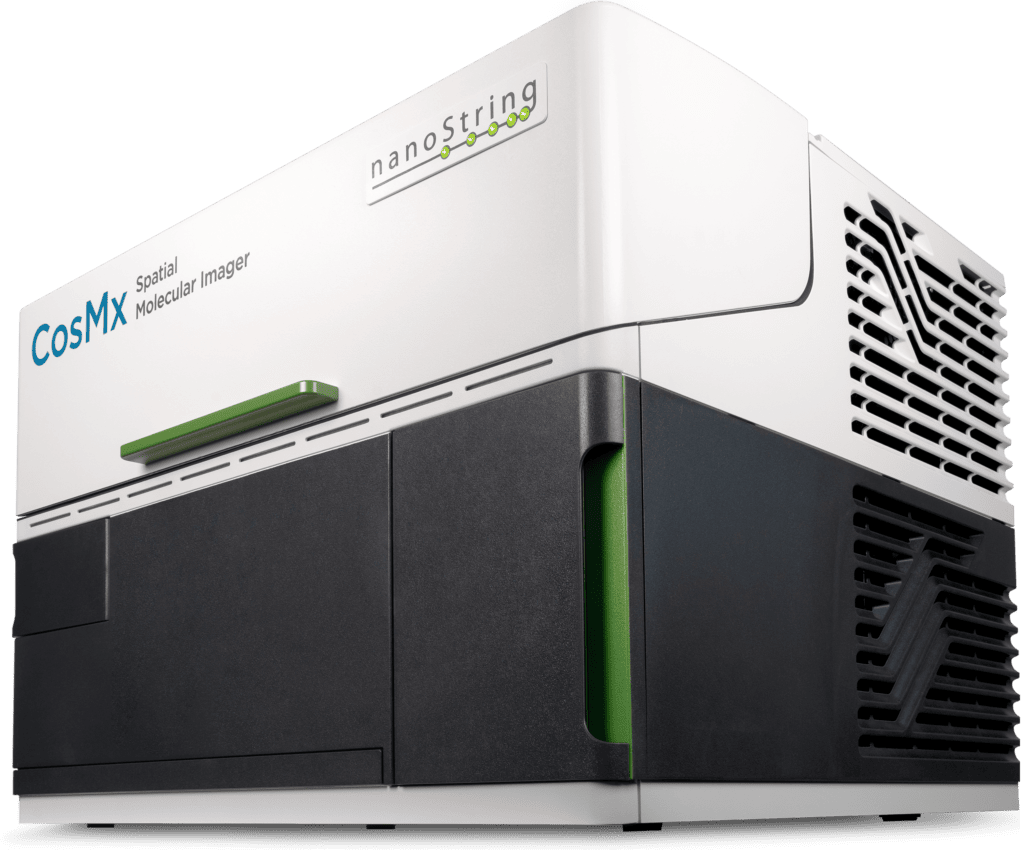
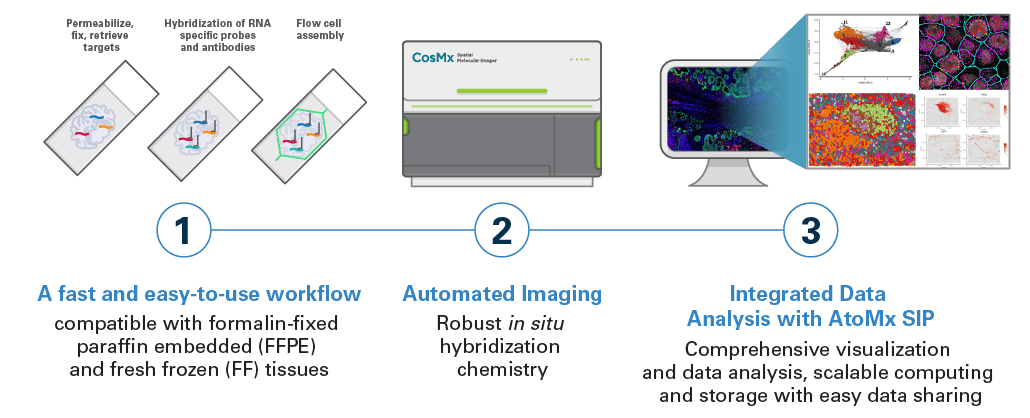
Powered by an integrated platform
CosMx SMI combines high‑plex imaging, flexible RNA panels (targeted to whole transcriptome, human and mouse), and AtoMx software for end‑to‑end spatial analysis.
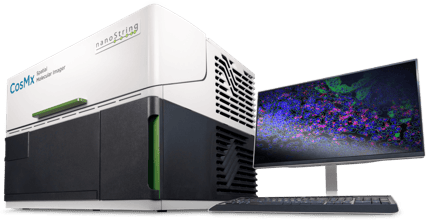
Instrument
Highest sensitivity and plex multiomic instrument accomplished at single-cell and subcellular resolution
Panels & Assays
CosMx RNA and protein panels/assays enable targeted and whole-transcriptome scale spatial discovery.
AtoMx SIP
A unified cloud-native workflow designed to accelerate every stage of spatial data analysis journey.
Trusted by leading researchers in spatial biology
“We are impressed with ease of use with which the CosMx SMI enabled single cell spatial transcriptomics across various tissue types, even in archival FFPE tissue. The high-plex protein assay makes the CosMx SMI a true multiomic solution. The CosMx SMI’s large capture area allows analysis from valuable clinical trial samples using tissue microarrays, enabling characterization of 100s of samples weekly.”

Dr. Nigel B Jamieson
Professor of Surgery, University of Glasgow, UK
“At last count, we have processed 160 samples with the CosMx SMI, including tumor and mouse brain samples. This technology uncovers vital insights into cell biology, enhancing our understanding of both malignant and normal tissues. It is crucial for creating spatial biomarkers and improving patient outcomes. Plus, the equipment and protocols are reliable and user-friendly.”

Dr. Aubrey Thompson
Mayo Clinic Comprehensive Cancer Center, Florida
“The CosMx SMI instrument has become integral to our laboratory’s future direction, and the responsiveness and skill of the customer support for it and the AtoMx SIP has been absolutely fantastic.”

Dr. Grant Kolar
Director, Research Microscopy and Histology Core, St. Louis University School of Medicine
CellScape XR Platform Research Applications
Discover how the CellScape XR platform enables quantitative spatial phenotyping across translational and discovery research workflows.
Oncology
Characterize tumor heterogeneity, immune cell states, and biomarker expression in intact tissue. Quantitative spatial phenotyping reveals clinically relevant cell populations and spatial interactions that drive disease progression.
Immunology
Define immune phenotypes, functional neighborhoods, and tissue-specific immune responses with quantitative spatial proteomics. Resolve subtle expression differences that shape immunity and inflammation.
Neuroscience
Map neuronal and glial phenotypes across complex tissue architecture. Quantify protein expression and spatial organization to investigate neurodegeneration, injury, and brain function. (link)
Infectious Disease
Confirm candidate cell states, biomarkers, and spatial interactions within their native tissue context. Quantitative spatial phenotyping transforms discovery findings into biologically actionable evidence.

From sample to quantitative spatial phenotyping
Generate high-plex spatial proteomics data through iterative cycles of staining, imaging, and EpicIF signal removal. Quantitatively characterize spatial phenotypes across whole tissue sections while preserving valuable samples for future analysis.
Step 1. Prepare your sample
Prepare FFPE, fresh frozen, or PBMC samples on a standard glass slide. A specialized coverslip creates a microfluidic environment for automated cyclic immunofluorescence.
Step 2. Stain, image, erase, repeat
Stain tissue with fluorescently labeled primary antibodies, capture high-resolution images, then remove fluorescent signal with EpicIF chemistry. Repeat the cycle with new marker sets to build highly multiplexed spatial proteomics datasets from the same tissue section.
Step 3. Quantify spatial phenotypes
Combine imaging cycles into a single dataset for quantitative spatial phenotyping. Analyze cell states, biomarker expression, and spatial interactions across intact tissue at single-cell and subcellular resolution.
Explore the CosMx SMI resource library


Find the right platform for your research
| Platform |  nCounter nCounterLearn more |  GeoMx GeoMxLearn more | CosMx Learn more | 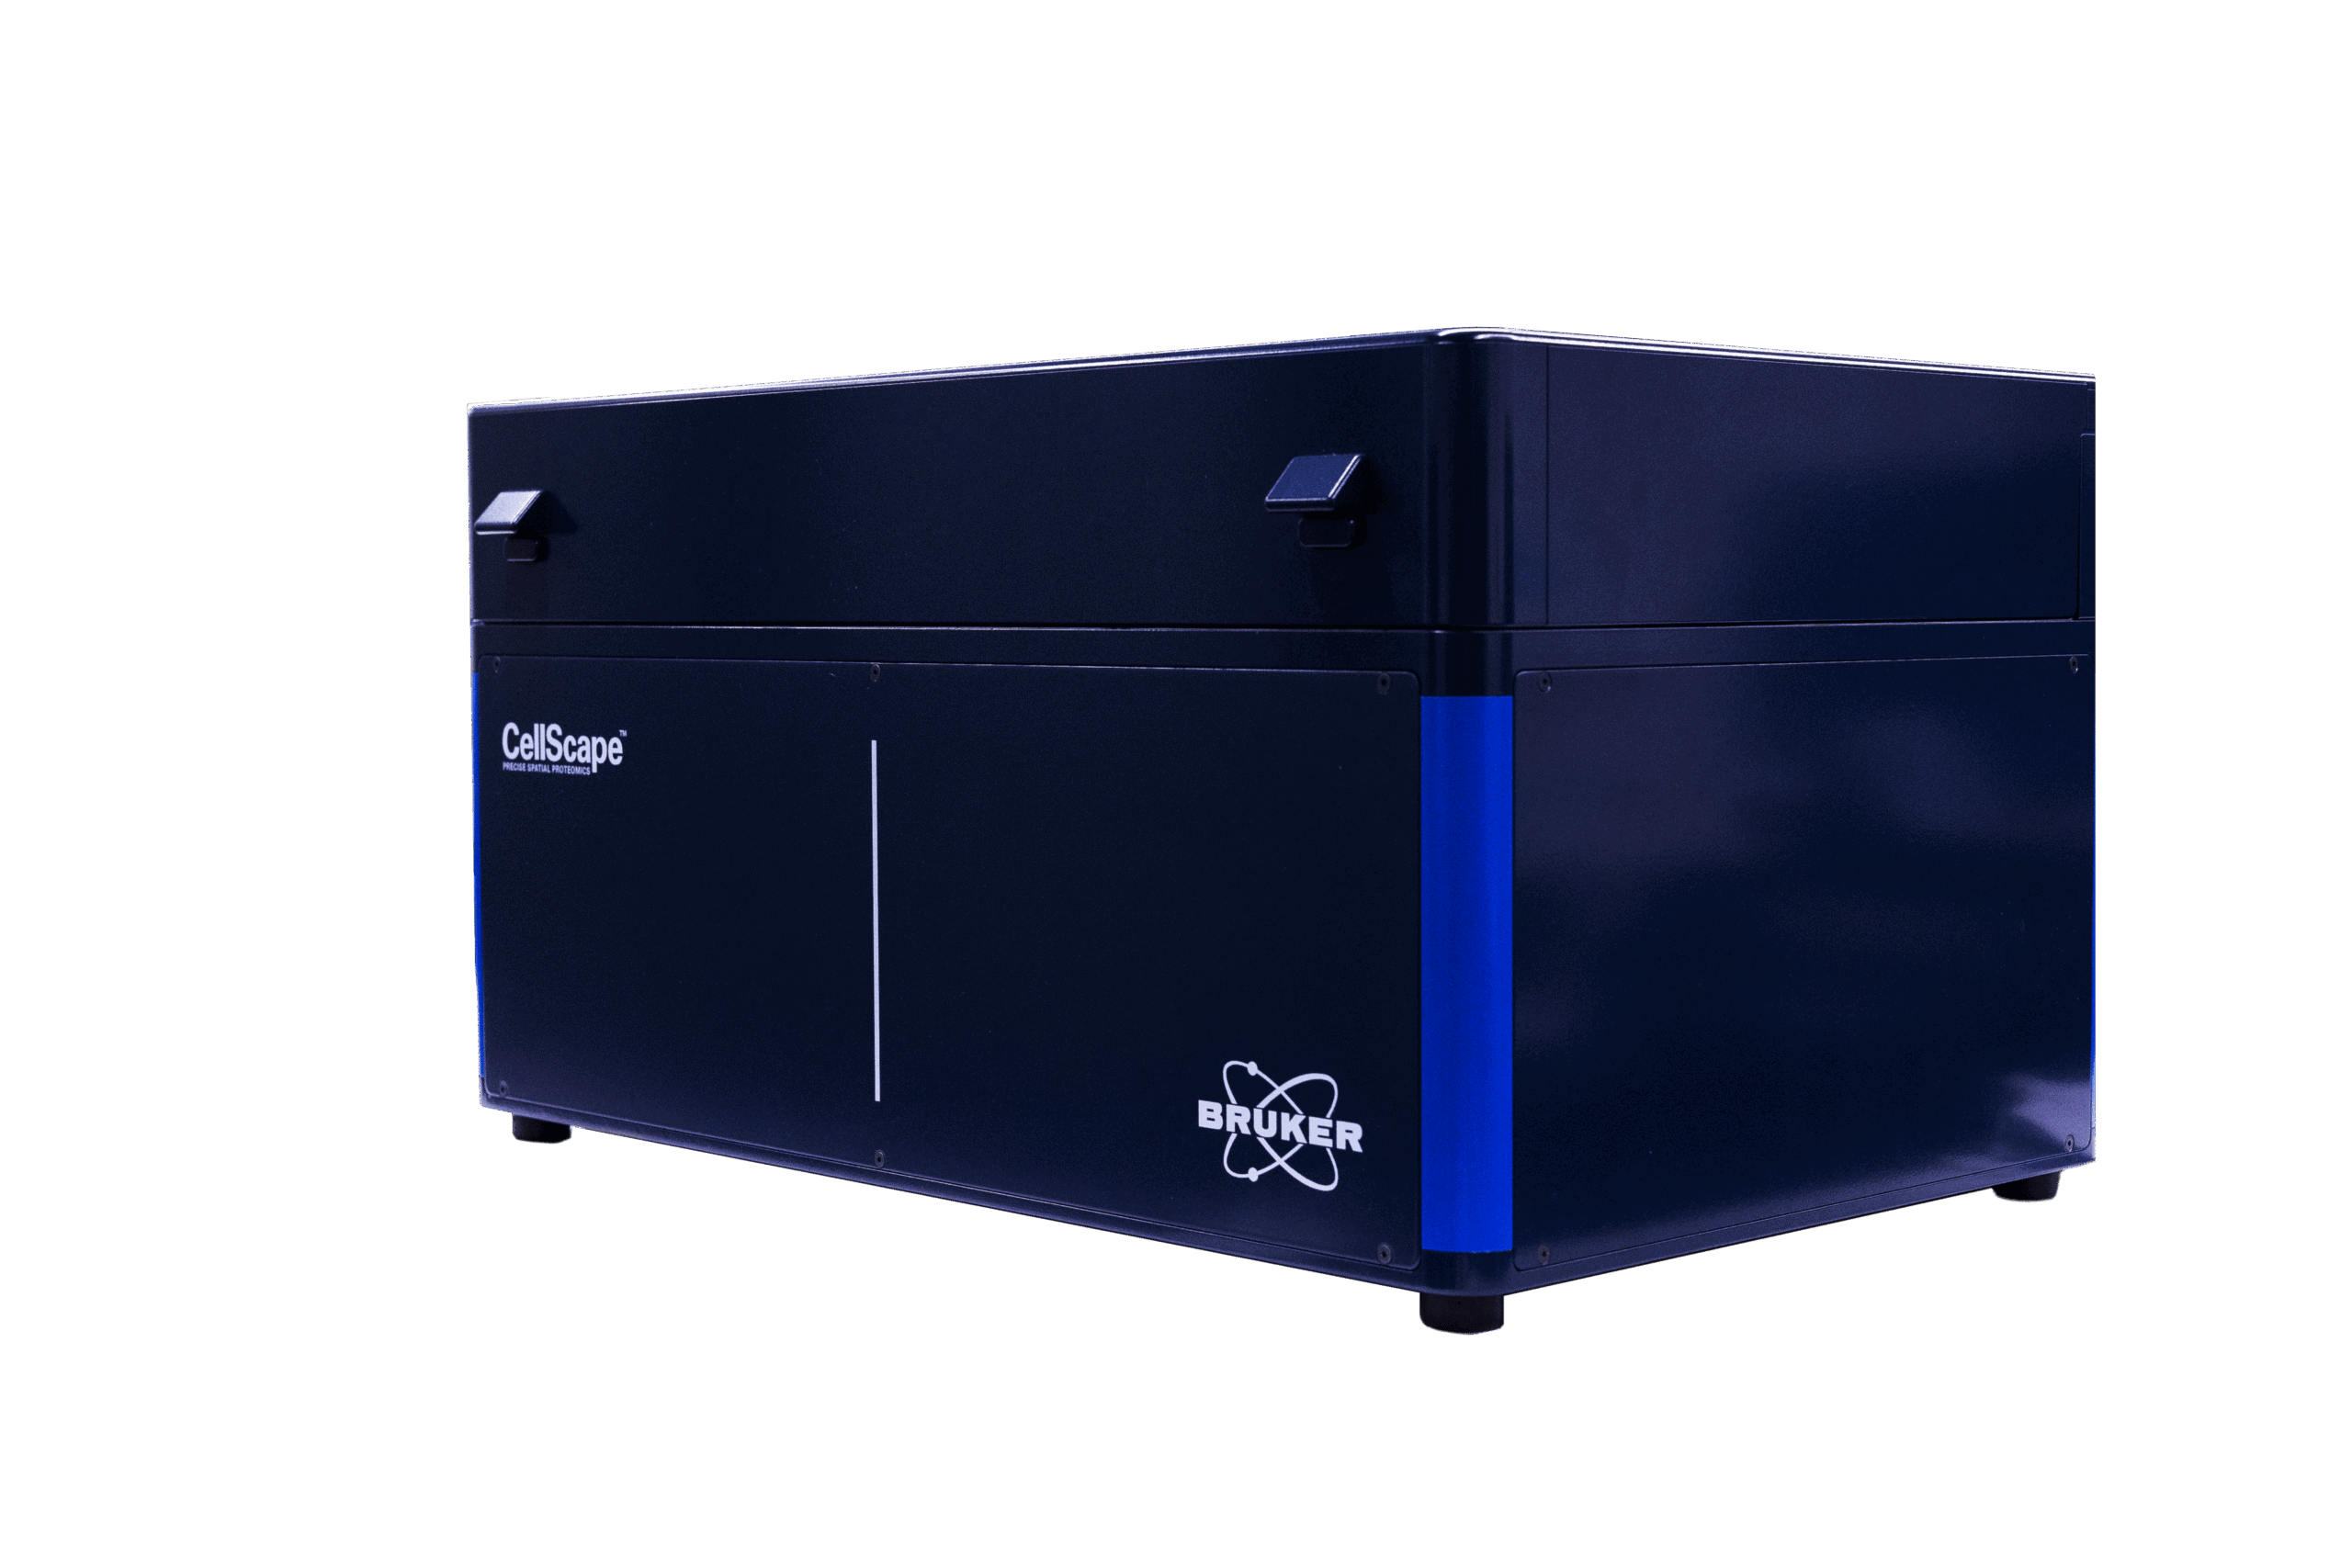 CellScape CellScapeLearn more | PaintScape Learn more |
| Applications | Rapid and robust targeted RNA and multiomic expression proven for translational and clinical studies | Early biomarker discovery through high-throughput, cost-effective and high-plex RNA and protein screening | High sensitive subcellular imaging of the whole transcriptome for pathway-level spatial insights | Flexible subcellular proteomics for rapid and quantitative spatial phenotyping | High precision, multiplexed direct visualization of the 3D genome |
| Analyte | miRNA, RNA, protein | RNA, protein | RNA, protein | Protein, RNA | DNA |
| Plex level | 800+ RNA 500+ protein | Targeted RNA assays (up to 2000 targets) Whole transcriptome RNA assays Up to 1200 proteins | Target RNA assays (up to 6000 targets) Whole transcriptome RNA assays Up to 64 proteins | Targeted protein assays (up to 34 targets) Customizable assays up to 20 | Targetd DNA Assays (419+ targets) |
| Resolution | Bulk | Multicellular (RNA) Single-cell (protein) | Single-cell Subcellular | Single-cell Subcellular | Single-nuclei |
| Sample compatibility | FFPE, FF, lysate | FFPE, FF | FFPE, FF | FFPE, FF, cell suspension, lysate | Human cell lines, FF tissue (coming soon) |
| Data readout | nCounter (Direct counting) | NGS, nCounter (Direct counting) | Imaging | Imaging | Imaging |
Ready to see what the CellScape XR platform can do for your research?
Speak with a spatial biology specialist, request a quote, or explore open spatial biology datasets to accelerate your next discovery.
CellScape XR Frequently Asked Questions
What is the CellScape XR platform?
The CellScape XR platform is a high-plex multiplexed immunofluorescence (mIF) system for quantitative single-cell spatial proteomics. It uses cyclic staining with directly conjugated antibodies, EpicIF signal removal, and whole-slide imaging at 182 nm/px to map protein expression across intact tissue at single-cell and subcellular resolution.
How does CellScape XR compare to other spatial proteomics platforms
?The CellScape XR platform delivers quantitative single-cell proteomics without forcing a tradeoff between imaging fidelity and assay flexibility. Unlike platforms that require proprietary reagents, it runs any IHC-validated, directly conjugated antibody — whether our VistaPlex Assays or 6,000+ off the shelf — so you design panels around your biology, not the platform.
How many protein markers can the CellScape XR platform measure?
The CellScape XR platform supports 200+ plex using cyclic mIF — up to 5 markers per cycle across 7 optical channels, with EpicIF signal removal between cycles. Published work has reached 208-plex across diverse tissue types.
What antibodies can I use with the CellScape XR platform?
The CellScape XR platform works with any IHC-validated primary antibody, directly conjugated to an organic dye. Start with VistaPlex Multiplexing Assay Kits, add from 6,000+ off-the-shelf conjugated antibodies, or label your own with VistaFlex Antibody Labeling Kits, in partnership with ProteinTech Group, in under 10 minutes.
What sample types are compatible with the CellScape XR platform?
The CellScape XR platform is compatible with FFPE and fresh frozen tissue sections on standard slides, as well as cell suspensions and lysate.
What spatial proteomics data can I explore from the CellScape XR platform?
You can explore real high-plex spatial proteomics datasets in the interactive CellScape Data Explorer, including FFPE breast, colorectal, head and neck, and melanoma cancer tissue. Toggle markers, zoom from whole-tissue architecture to subcellular detail, and assess staining specificity and phenotyping directly in your browser — no downloads required.
Is the CellScape XR platform suitable for translational and clinical research?
Yes, the CellScape XR platform uses directly conjugated antibodies and reproducible cyclic workflows that align with CAP/CLIA validation requirements, supporting biomarker validation across large patient cohorts. Consistent quantitative performance from pilot to cohort scale suits it to translational and clinical-readiness studies. (For Research Use Only.)
How does the CellScape XR platform work with GeoMx DSP and CosMx SMI?
The CellScape XR platform is the validation and phenotyping anchor of the Bruker Spatial Biology ecosystem. Discover relevant RNA or protein biomarkers at multicellular level with GeoMx DSP, or single-cell RNA signatures with CosMx SMI, and validate those findings at single-cell protein resolution with the CellScape XR platform.