
A Technical Deep-Dive into High-Fidelity Spatial Transcriptomics with CosMx® SMI
Authors: Kalyan Chavda, Christine Kang, Martin Shelton, Prajan Divakar
As spatial biology transitions into a foundational tool in scientific research, Core Lab Managers and Principal Investigators are faced with an overwhelming array of spatial platforms. But not all spatial technologies are created equal. As we push the boundaries to subcellular resolution and whole-transcriptome scale, the nuances of assay chemistry, technical performance, and analytical pipelines become critical.
In this deep-dive, we will unpack the technical realities of the CosMx® Spatial Molecular Imager (SMI) platform to address common misconceptions in the field, describe core concepts behind the CosMx SMI platform, and explain why a “fit-for-purpose” analytical approach is required to achieve true biological insights.
The Foundational Chemistry: FFPE-Validated Direct Hybridization Chemistry
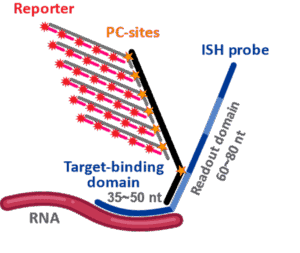
At the heart of any spatial platform is its signal generation chemistry. The CosMx SMI platform utilizes a direct hybridization chemistry, meaning there is zero enzymatic amplification involved in signal generation. A CosMx probe is comprised of two parts: 1) a single-stranded ISH probe (Figure 1), which consists of a target-binding domain that binds directly and specifically to complementary RNA sequences in cells and 2) a readout domain which serves as landing sites for branched fluorescent reporter structures to bind to so that the optical barcode for each bound ISH probe can be read out on the CosMx instrument through sequential imaging cycles. The short 35-50 nucleotide target binding domains also enable robust performance in FFPE tissues, which are the most critical sample type for spatial biology.
Unlike many competing spatial technologies, CosMx SMI does not use enzymatic amplification. The distinction may seem subtle—but this is the fundamental reason why CosMx SMI is the world’s first and only imaging platform to traverse subcellular spatial whole transcriptome biology from an FFPE tissue section. Our direct in situ hybridization chemistry builds on nearly two decades of proven innovation, including the nCounter® analysis system and its FDA 510(k) cleared prognostic breast cancer gene signature assay (1). This chemistry is well validated, highly robust, and trusted in both research and clinical settings.
This highly robust and sensitive chemistry is central to CosMx SMI and because it directly measures RNA in the tissue without enzymatic amplification, there are no sequencing costs, nor loss of cells through dissociation. Every transcript is measured exactly where it belongs within the tissue.
Moreover, because the direct hybridization approach does not rely on enzymatic amplification, this chemistry enables tight control of optical crowding and avoids “optical budget” tradeoffs common with other spatial imaging technologies. This direct hybridization chemistry is what makes whole transcriptome scale spatial imaging possible on the CosMx platform.
Refining Key Performance Metrics
1) Sensitivity in CosMx SMI Assays
The most important research questions a spatial imager must answer are: How much biology can I see with this instrument? Will the spatial data provide only a cell-type map, or will it support more advanced analyses? Sensitivity and plex are key parameters that determine how much biological information can be spatially resolved in a tissue sample. A higher-plex spatial assay allows researchers to measure more genes simultaneously, enabling the observation of multiple biological processes occurring within the tissue. Higher plex assays also typically capture a greater total number of transcripts per cell compared to lower-plex assays. This is critical because in spatial biology, you can’t see what you don’t target.
The design goal of the CosMx SMI was to approach the capabilities of single-cell RNA sequencing while maintaining spatial and subcellular resolution. In this context, sensitivity is evaluated using two primary metrics: the total number of transcripts detected per cell and the diversity of genes detected per cell. Together, these metrics describe the ability of the assay to capture both the abundance and breadth of gene expression in spatial context.
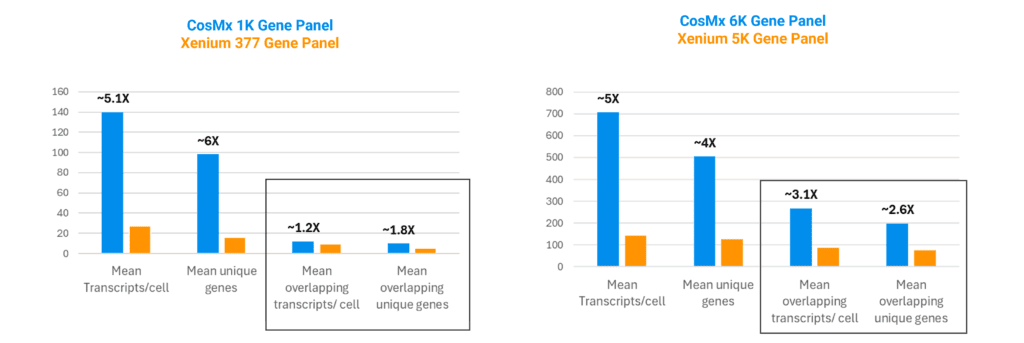
The spatial biology field is currently plagued by flawed “benchmarking studies”, comparisons with conclusions built on an “N of 1” (2) or worse, assays run on tissue sections that have been left to degrade for weeks on a benchtop (3). True comparisons require a clean and unbiased experimental design. In a recent, highly controlled study out of Northwestern University, researchers eliminated these confounding variables (4). They took 16 real-world FFPE blocks from 11 patients, cut sequential sections at identical thicknesses, and prepared them immediately for both the CosMx 1.0 and Xenium platforms to erase RNA degradation bias. To ensure an apples-to-apples comparison, they restricted their analysis strictly to the overlapping genes shared by both panels. The results demonstrated: when experimental noise is stripped away and platforms compete purely on the sensitivity of their chemistry, CosMx routinely detects exponentially more transcripts and up to six times the gene diversity (Figure 2).
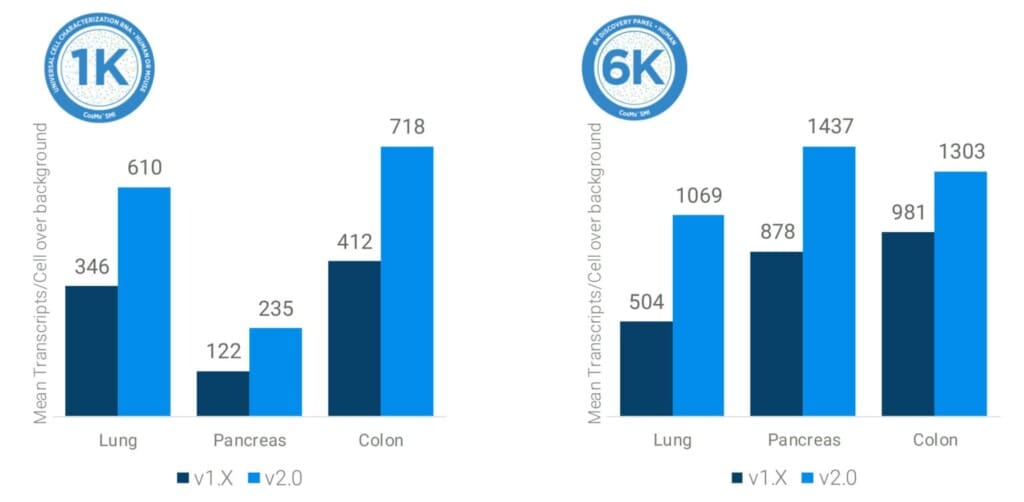
With the introduction of the CosMx 2.0 integrated software and hardware advancements, CosMx instruments benefit from an additional up to 2x increase in RNA detection efficiency across all RNA assays. This includes both 1K and 6K targeted panels and enables even more transcripts to be detected per cell (Figure 3). Crucially, this doubling of counts is achieved without negatively impacting the signal-to-noise ratio.
2) Specificity in CosMx SMI Assays
In the realm of high-plex spatial transcriptomics, one of the most pervasive technical misunderstandings is the routine conflation of Specificity with Background. For the CosMx SMI, these are two distinct technical concepts.
- Specificity: Specificity is the ability of the 35 to 50 nucleotide target-binding domain to bind exclusively to its complementary target RNA sequence and not to any other RNA sequences.
- Background: Background refers to overall tissue stickiness, where a probe may interact with non-RNA elements in the tissue, typically via electrostatic interactions. This is mathematically modeled using negative control probes with alien sequences.
Specificity asks the question: Is this probe hybridizing to the correct endogenous RNA transcript? The CosMx direct hybridization chemistry guarantees exceptional specificity through its fundamental probe design built on more than two decades of probe development originally pioneered at NanoString Technologies for the nCounter® analysis system. Background, on the other hand, answers the question: How much “stickiness” (where ISH probes may electrostatically interact with non RNA in the tissue) is inherent to this specific tissue slice? Because background is distributed randomly, it acts purely as statistical noise rather than a spatially correlated confounder.
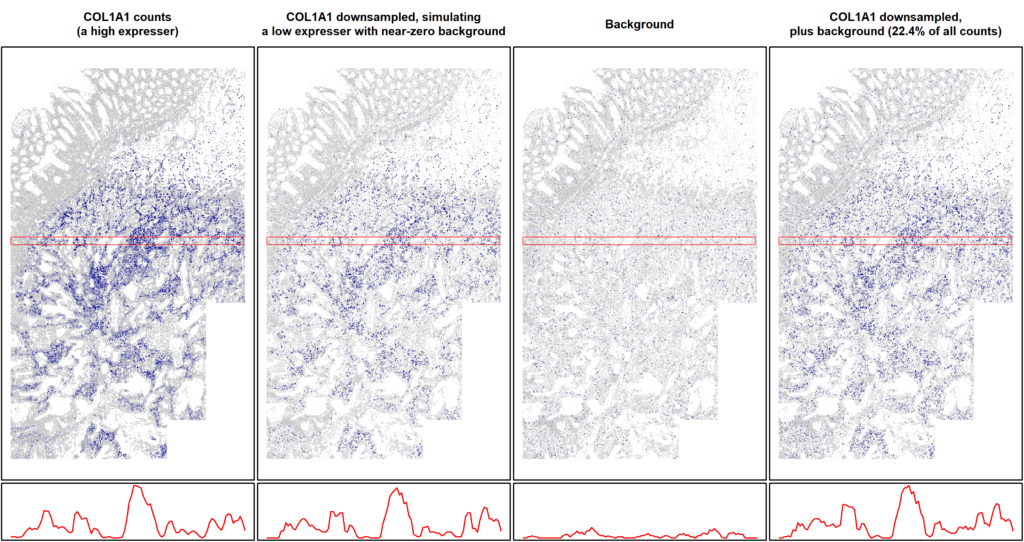
This dynamic is demonstrated through signal downsampling simulations (as showcased in Figure 4): if you take a highly specific, high-expressing gene like COL1A1, computationally downsample its counts to simulate a sparse, low-expressing target, and then artificially add background noise so that it comprises over 20% of the total signal, the native spatial architecture of the tissue still remains intact. The reality is, when your fundamental probe chemistry is rigorously specific, true spatial patterns will still appear in your tissue (5).
3) Accuracy in Spatial Transcriptomics Assays
In spatial transcriptomics, accuracy means assigning every transcript to the correct cell. If transcripts are placed in the wrong cell, biology becomes misleading, no matter how sensitive the detection chemistry is. In practice, the largest source of error in spatial transcriptomics is cell segmentation.
Segmentation is difficult because real tissues are complex. Cells vary widely in size and shape, often pack tightly together, and extend cytoplasmic processes beyond their nuclei. Segmentation methods based only on nuclear expansion frequently misassign transcripts to neighboring cells. These errors propagate into downstream analyses, distorting cell typing, pathway interpretation, and cell–cell interaction analysis.
From the very beginning, CosMx analysis methods committed to a multimodal approach for cell segmentation (6). In comparison, other platforms initially relied on techniques like nuclear expansion, and only later began to adopt multimodal approaches. Instead of inferring boundaries, CosMx SMI precisely defines them by explicitly imaging both the nuclei and the cytoplasm to capture the true physical borders of the cell.
Recent advances from Bruker Spatial Biology further extend this capability with the 3D AI segmentation models implemented in the AtoMx Spatial Informatics Platform. By reconstructing cells across multiple focal planes, these models resolve overlapping cells and improve single-cell boundary definition in dense tissues, overcoming long-standing limitations of traditional segmentation approaches. Finally, the segmentation models are purpose-trained using machine learning on diverse tissue types, enabling robust performance across complex samples such as brain tissues.
The result is straightforward but critical: when the cell boundaries are correct, the biology becomes trustworthy. In spatial biology, the chemistry finds the RNA but segmentation reveals the biology and context.
Fit-for-Purpose Analytics: Escaping the Amplification Echo Chamber
The final, and perhaps most critical, hurdle in high-plex spatial transcriptomics is the computational pipeline. There is a common reflex to try using legacy single-cell RNA-seq algorithms like standard Seurat or Squidpy to analyze direct hybridization CosMx data. However, applying the wrong algorithms to your CosMx data will fundamentally obscure the biology and blunt the impact of your data.
Legacy single-cell algorithms were explicitly designed to handle the data distributions that come from amplified detection chemistry. They rely on amplification variance, the artificial inflation of a few highly expressed genes, to pull cell clusters apart in dimensional space. Direct hybridization chemistry has no amplification. Instead, it generates a massive, unamplified genomic tail, yielding a staggering diversity of unique genes per cell.
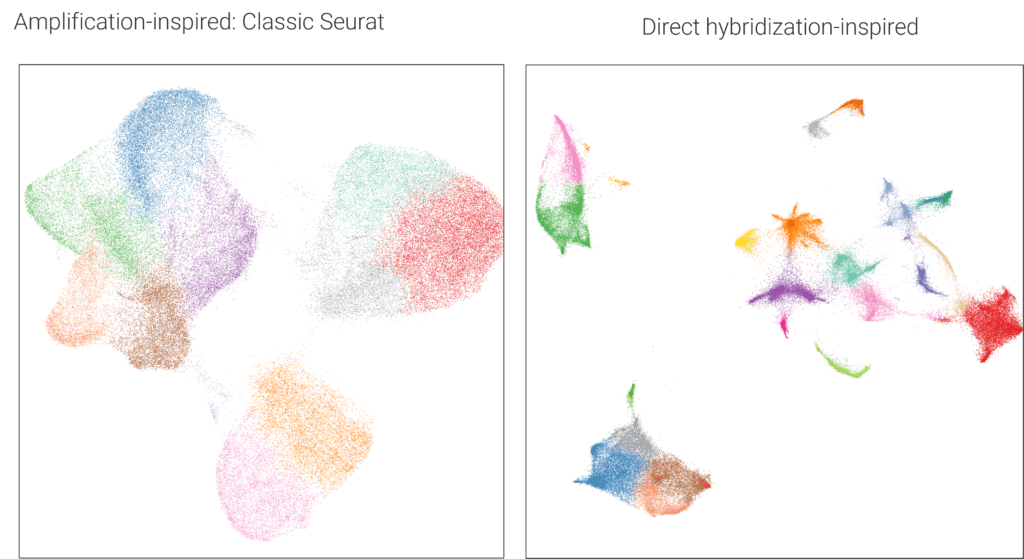
When you feed this rich, unamplified genomic tail into a standard adjacency-based clustering tool, the algorithm misinterprets the data. Because there are no artificially inflated peaks to force separation, the principal components collapse, pulling distinctly different cell types together. This is why applying, for example, Seurat to direct hybridization data will notoriously fuse T-cells, B-cells, and plasma cells into a single, biologically meaningless cluster (Figure 5).
As a result, CosMx data requires analysis with mathematical models designed for its unique chemistry to maximize potential discoveries. Recognizing these challenges, Bruker Spatial Biology have invested heavily in developing and validating the precise mathematical models required to maximize the discoveries made with this unique chemistry. One of the main resources is the Scratch Space blog . This blog has been around for several years and serves as a central hub for more than 50 articles, best practices, and open-source code examples specifically designed for working with CosMx data. In particular, the new comprehensive WTX guide for whole transcriptome CosMx analysis walks through every step you need to project functional biology directly onto your tissue.
Conclusion: Cell Typing is Only the Beginning
Spatial transcriptomics is rapidly becoming an essential technology for understanding tissue biology. However, the value of a spatial platform depends on more than simply detecting transcripts. It requires the integration of multiple technical components: robust assay chemistry, unmatched sensitivity, precise molecular specificity, accurate cell segmentation, and analytical frameworks designed specifically for that spatial data.
The CosMx Spatial Molecular Imager was designed with these principles in mind. Its direct hybridization chemistry enables high-plex and whole-transcriptome measurements at single cell sub-cellular resolution. High detection sensitivity allows both abundant and rare transcripts to be measured across thousands of genes simultaneously. Rigorous probe design ensures high molecular specificity, while multimodal and 3D AI segmentation models accurately define cellular boundaries in complex tissues.
Together, these components ensure that transcripts are not only detected, but correctly assigned to the cells that produced them. This distinction is critical. In spatial biology, meaningful interpretation depends on linking molecular information to the correct cellular context within the tissue.
As spatial assays scale toward whole-transcriptome coverage and subcellular resolution, the challenge shifts from simply generating data to extracting reliable biological insight from complex tissue systems. Platforms capable of maintaining accuracy across chemistry, imaging, and computational analysis will ultimately determine how effectively spatial technologies contribute to biological discovery.
In this context, spatial transcriptomics becomes more than just a method for mapping cell types. When molecular detection, segmentation accuracy, and analytical rigor align, spatial measurements reveal how cells organize, interact, and function together within intact tissues. And that is where spatial biology moves from descriptive mapping to true mechanistic understanding of disease and development.
References
- Cesano, A. nCounter® PanCancer Immune Profiling Panel (NanoString Technologies, Inc., Seattle, WA). j. immunotherapy cancer 3, 42 (2015). https://doi.org/10.1186/s40425-015-0088-7
- David P. Cook, Kirk B. Jensen, Kellie Wise, Michael J. Roach, Felipe Segato Dezem, Natalie K. Ryan, Michel Zamojski, Ioannis S. Vlachos, Simon R. V. Knott, Lisa M. Butler, Jeffrey L. Wrana, Nicholas E. Banovich, Jasmine T. Plummer, Luciano G. Martelotto. A Comparative Analysis of Imaging-Based Spatial Transcriptomics Platforms. bioRxiv 2023.12.13.571385; doi: https://doi.org/10.1101/2023.12.13.571385
- Wang, H., Huang, R., Nelson, J. et al. Systematic benchmarking of imaging spatial transcriptomics platforms in FFPE tissues. Nat Commun 16, 10215 (2025). https://doi.org/10.1038/s41467-025-64990-y
- Dulai, P. A Comparative Analysis: CosMx™ SMI versus Xenium – Superior In situ Single Cell Performance Study. GenomeWeb Webinar – Feb 22, 2024. https://www.youtube.com/watch?v=VgN9qQMECBU
- Danaher, P. (2024). How does background impact CosMx data, and when does it matter? Retrieved from https://nanostring-biostats.github.io/CosMx-Analysis-Scratch-Space/posts/background/
- Wu, L., Wardhani, A., & Phan, J. (2025). Advancing cell segmentation in spatial omics: new models for diverse morphologies. Retrieved from https://nanostring-biostats.github.io/CosMx-Analysis-Scratch-Space/posts/image-segmentation-models/


